Project Diagrams
Project diagrams do not have to be boring. On this page, I showcase my work in designing clear, visually engaging organisational project diagrams and workflow timelines. Each diagram is crafted to turn complex project organization into appealing and intuitive visuals that support better planning, communication, and decision-making.
Doctoral programs organisational chart
One of the last work of Pixell Biology, crafted for a multi-doctoral grant application, in collaboration with David Vanneste.
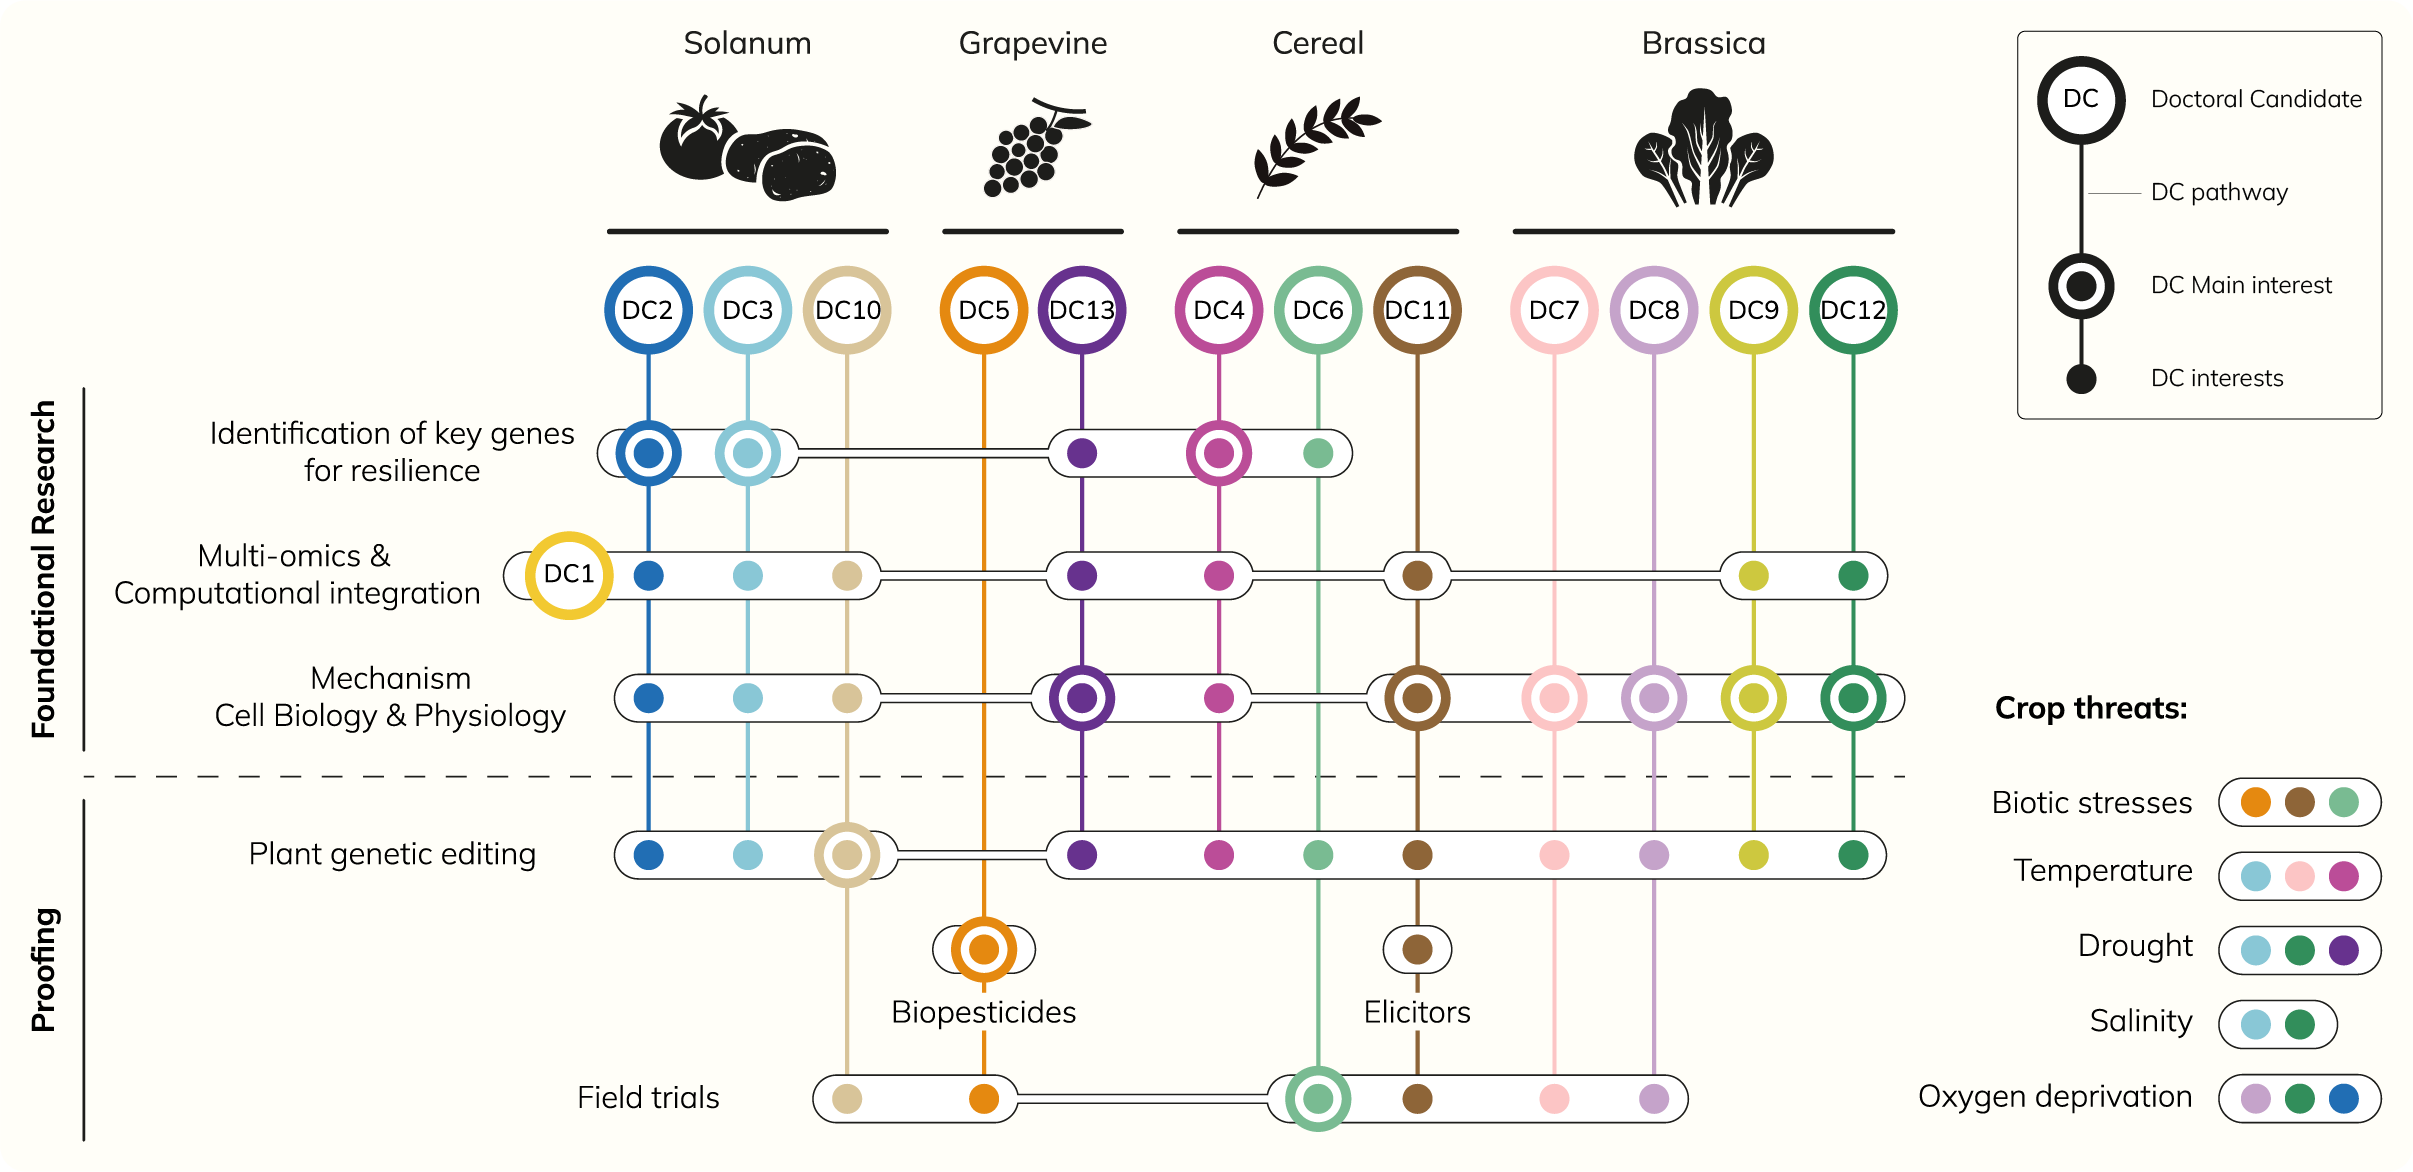
The aim was to clarify the role of 13 doctoral candidates in a european research programme gathering 10 laboratories to better understand plants resilience towards future biotic and abiotic threats.
To do so, every doctoral project is represented with a coloured line stopping – or not – at different areas of interest. This chart highlights the multidimensional aspect of the research programme, and how the doctoral students will collaborate to comprehensively tackle potential future crop threats.
Fun fact: Colours come from the Parisian Metro color code (for the most part)
Program used:
Adobe Illustrator